How much can I expect to earn as a Medical Technologist or Clinical Lab Technician?
According to the Bureau of Labor Statistics The median annual wage for clinical laboratory technologists and technicians was $54,180 in May 2020. The median wage is the wage at which half the workers in an occupation earned more than that amount and half earned less. The lowest 10 percent earned less than $31,450, and the highest 10 percent earned more than $83,700.
In May 2020, the median annual wages for clinical laboratory technologists and technicians in the top industries in which they worked were as follows:
| Outpatient care centers | $57,640 |
| General medical and surgical hospitals; state,local, and private | $56,630 |
| Junior colleges, colleges, universities, and professional schools; state, local, and private | $52,260 |
| Medical and diagnostic laboratories | $52,250 |
| Offices of physicians | $48,260 |
Most clinical laboratory technologists and MTs work full time. Technologists and technicians who work in facilities that are always open, such as hospitals and some independent laboratories, may work evening, weekend, or overnight hours.
Medical Tech Salary by State
| State | Average Salary | Median Salary | Lowest Salary |
|---|---|---|---|
| Alabama | $46,968 | $45,120 | $31,704 |
| Alaska | $76,044 | $70,212 | $50,964 |
| Arizona | $58,464 | $57,276 | $37,428 |
| Arkansas | $44,508 | $42,852 | $29,976 |
| California | $62,664 | $60,828 | $37,860 |
| Colorado | $58,128 | $56,868 | $38,004 |
| Connecticut | $65,508 | $65,172 | $42,960 |
| District of Columbia | $70,380 | $71,460 | $51,024 |
| Delaware | $60,060 | $59,328 | $41,160 |
| Florida | $49,296 | $45,792 | $31,656 |
| Georgia | $49,572 | $47,268 | $30,612 |
| Hawaii | $57,684 | $58,932 | $29,532 |
| Idaho | $46,680 | $43,824 | $27,864 |
| Illinois | $69,156 | $67,200 | $39,420 |
| Indiana | $51,900 | $49,212 | $29,532 |
| Iowa | $54,924 | $51,972 | $33,468 |
| Kansas | $52,572 | $50,772 | $29,280 |
| Kentucky | $46,068 | $44,628 | $27,816 |
| Louisiana | $51,096 | $48,744 | $32,592 |
| Maine | $51,672 | $51,468 | $35,988 |
| Maryland | $59,844 | $57,996 | $34,752 |
| Massachusetts | $67,428 | $67,548 | $42,024 |
| Michigan | $56,940 | $53,868 | $35,256 |
| Minnesota | $57,300 | $56,616 | $36,960 |
| Mississippi | $42,480 | $41,412 | $25,176 |
| Missouri | $55,416 | $54,012 | $34,044 |
| Montana | $55,464 | $53,328 | $35,472 |
| Nebraska | $55,656 | $52,332 | $36,456 |
| Nevada | $59,400 | $60,756 | $36,768 |
| New Hampshire | $56,424 | $54,924 | $38,160 |
| New Jersey | $64,836 | $64,104 | $40,992 |
| New Mexico | $46,788 | $47,724 | $26,604 |
| New York | $62,268 | $60,636 | $34,152 |
| North Carolina | $48,228 | $45,648 | $32,436 |
| North Dakota | $54,552 | $53,484 | $38,832 |
| Ohio | $52,428 | $51,096 | $32,244 |
| Oklahoma | $49,752 | $48,120 | $30,744 |
| Oregon | $60,204 | $57,300 | $34,092 |
| Pennsylvania | $54,816 | $53,268 | $35,004 |
| Rhode Island | $65,100 | $63,588 | $48,000 |
| South Carolina | $44,232 | $43,284 | $28,752 |
| South Dakota | $50,724 | $47,220 | $31,956 |
| Tennessee | $46,968 | $44,916 | $29,772 |
| Texas | $48,792 | $47,160 | $29,304 |
| Utah | $52,836 | $50,376 | $35,652 |
| Vermont | $52,188 | $52,308 | $37,764 |
| Virginia | $51,504 | $48,696 | $30,456 |
| Washington | $61,608 | $59,196 | $38,412 |
| West Virginia | $42,540 | $39,216 | $25,368 |
| Wisconsin | $56,400 | $53,772 | $36,744 |
| Wyoming | $46,980 | $46,956 | $30,096 |
Figures based on 2019 data courtesy of the U.S. Department of Labor’s Occupational Employment & Wages database.
This occupation includes the 2018 SOC occupations 29-2011 Medical and Clinical Laboratory Technologists and 29-2012 Medical and Clinical Laboratory Technicians.
National estimates for Clinical Laboratory Technologists and Technicians
Industry profile for Clinical Laboratory Technologists and Technicians
Geographic profile for Clinical Laboratory Technologists and Technicians
National estimates for Clinical Laboratory Technologists and Technicians:
Employment estimate and mean wage estimates for Clinical Laboratory Technologists and Technicians:
| Employment (1) | Employment RSE (3) | Mean hourly wage | Mean annual wage (2) | Wage RSE (3) |
|---|---|---|---|---|
| 318,780 | 0.8 % | $ 27.36 | $ 56,910 | 0.3 % |
Percentile wage estimates for Clinical Laboratory Technologists and Technicians:
| Percentile | 10% | 25% | 50% (Median) | 75% | 90% |
|---|---|---|---|---|---|
| Hourly Wage | $ 14.56 | $ 18.26 | $ 27.79 | $ 35.83 | $ 38.15 |
| Annual Wage (2) | $ 30,280 | $ 37,990 | $ 57,800 | $ 74,530 | $ 79,340 |
Industry profile for Clinical Laboratory Technologists and Technicians:
Industries with the highest published employment and wages for Clinical Laboratory Technologists and Technicians are provided. For a list of all industries with employment in Clinical Laboratory Technologists and Technicians, see the Create Customized Tables function.
Industries with the highest levels of employment in Clinical Laboratory Technologists and Technicians:
| Industry | Employment (1) | Percent of industry employment | Hourly mean wage | Annual mean wage (2) |
|---|---|---|---|---|
| General Medical and Surgical Hospitals | 146,550 | 2.62 | $ 28.79 | $ 59,880 |
| Medical and Diagnostic Laboratories | 68,590 | 23.31 | $ 26.95 | $ 56,050 |
| Offices of Physicians | 30,800 | 1.14 | $ 25.51 | $ 53,060 |
| Colleges, Universities, and Professional Schools | 11,670 | 0.39 | $ 26.19 | $ 54,470 |
| Outpatient Care Centers | 11,280 | 1.14 | $ 28.73 | $ 59,750 |
Industries with the highest concentration of employment in Clinical Laboratory Technologists and Technicians:
| Industry | Employment (1) | Percent of industry employment | Hourly mean wage | Annual mean wage (2) |
|---|---|---|---|---|
| Medical and Diagnostic Laboratories | 68,590 | 23.31 | $ 26.95 | $ 56,050 |
| Other Ambulatory Health Care Services | 11,120 | 3.57 | $ 20.90 | $ 43,470 |
| General Medical and Surgical Hospitals | 146,550 | 2.62 | $ 28.79 | $ 59,880 |
| Outpatient Care Centers | 11,280 | 1.14 | $ 28.73 | $ 59,750 |
| Offices of Physicians | 30,800 | 1.14 | $ 25.51 | $ 53,060 |
Top paying industries for Clinical Laboratory Technologists and Technicians:
| Industry | Employment (1) | Percent of industry employment | Hourly mean wage | Annual mean wage (2) |
|---|---|---|---|---|
| Wholesale Electronic Markets and Agents and Brokers | (8) | (8) | $ 48.59 | $ 101,080 |
| Merchant Wholesalers, Nondurable Goods (4242 and 4246 only) | 210 | 0.05 | $ 37.64 | $ 78,290 |
| Computer Systems Design and Related Services | (8) | (8) | $ 35.35 | $ 73,520 |
| Navigational, Measuring,Electromedical, and Control Instruments Manufacturing | 60 | 0.02 | $ 34.95 | $ 72,690 |
| Management, Scientific, and Technical Consulting Services | 420 | 0.03 | $ 32.90 | $ 68,430 |
Geographic profile for Clinical Laboratory Technologists and Technicians:
States and areas with the highest published employment, location quotients, and wages for Clinical Laboratory Technologists and Technicians are provided. For a list of all areas with employment in Clinical Laboratory Technologists and Technicians, see the Create Customized Tables function
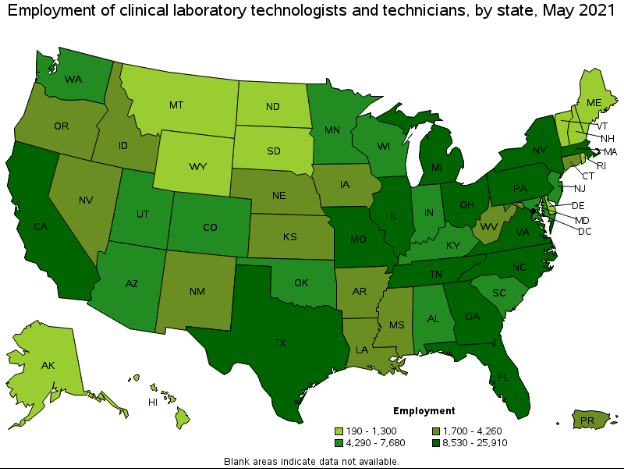
States with the highest employment level in Clinical Laboratory Technologists and Technicians:
| State | Employment (1) | Employment per thousand jobs | Location quotient (9) | Hourly mean wage | Annual mean wage (2) |
|---|---|---|---|---|---|
| California | 25,910 | 1.57 | 0.69 | $ 32.91 | $ 68,450 |
| Texas | 24,300 | 1.99 | 0.88 | $ 25.60 | $ 53,240 |
| Florida | 23,850 | 2.77 | 1.22 | $ 25.14 | $ 52,280 |
| New York | 17,030 | 1.96 | 0.87 | $ 34.85 | $ 72,500 |
| Ohio | 12,910 | 2.48 | 1.10 | $ 27.00 | $ 56,170 |
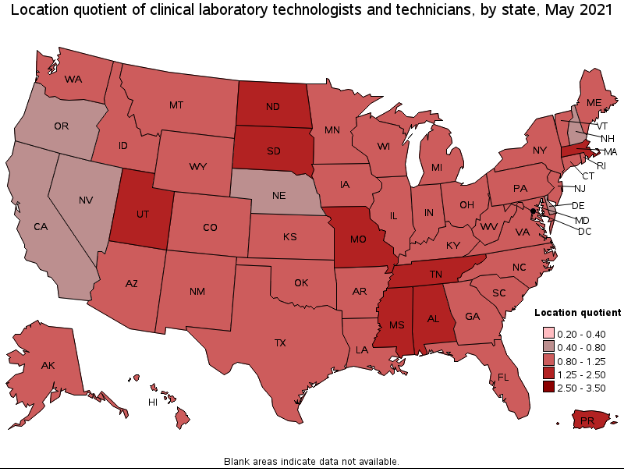
States with the highest concentration of jobs and location quotients in Clinical Laboratory Technologists and Technicians:
| State | Employment (1) | Employment per thousand jobs | Location quotient (9) | Hourly mean wage | Annual mean wage (2) |
|---|---|---|---|---|---|
| Massachusetts | 12,170 | 3.58 | 1.58 | $ 29.32 | $ 60,980 |
| Utah | 5,530 | 3.55 | 1.57 | $ 24.30 | $ 50,540 |
| North Dakota | 1,300 | 3.29 | 1.45 | $ 26.72 | $ 55,580 |
| Alabama | 6,170 | 3.20 | 1.42 | $ 22.20 | $ 46,170 |
| Missouri | 8,530 | 3.13 | 1.38 | $ 24.16 | $ 50,260 |
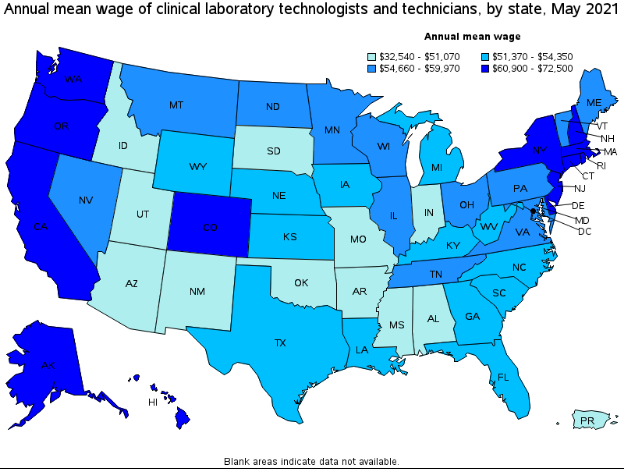
Top paying states for Clinical Laboratory Technologists and Technicians:
| State | Employment (1) | Employment per thousand jobs | Location quotient (9) | Hourly mean wage | Annual mean wage (2) |
|---|---|---|---|---|---|
| New York | 17,030 | 1.96 | 0.87 | $ 34.85 | $ 72,500 |
| Rhode Island | 900 | 1.97 | 0.87 | $ 33.93 | $ 70,580 |
| Connecticut | 3,210 | 2.04 | 0.90 | $ 33.76 | $ 70,220 |
| Oregon | 2,980 | 1.63 | 0.72 | $ 33.33 | $ 69,330 |
| California | 25,910 | 1.57 | 0.69 | $ 32.91 | $ 68,450 |
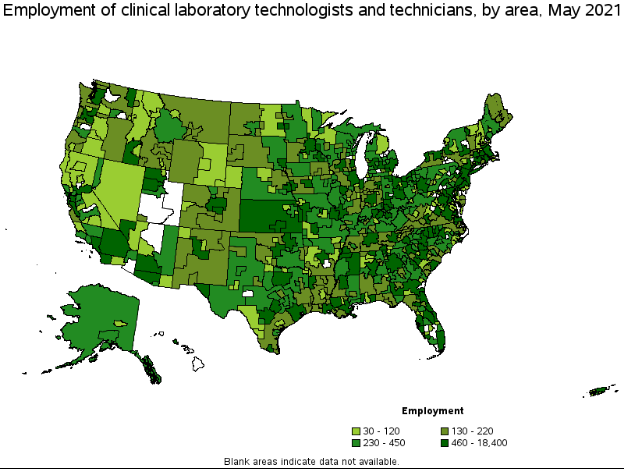
Metropolitan areas with the highest employment level in Clinical Laboratory Technologists and Technicians:
| Metropolitan area | Employment (1) | Employment per thousand jobs | Location quotient (9) | Hourly mean wage | Annual mean wage (2) |
|---|---|---|---|---|---|
| New York-Newark-Jersey City, NY-NJ-PA | 18,400 | 2.12 | 0.94 | $ 35.06 | $ 72,930 |
| Los Angeles-Long Beach-Anaheim, CA | 10,050 | 1.76 | 0.78 | $ 31.63 | $ 65,790 |
| Boston-Cambridge-Nashua, MA-NH | 9,810 | 3.79 | 1.68 | $ 29.47 | $ 61,290 |
| Chicago-Naperville-Elgin, IL-IN-WI | 9,030 | 2.13 | 0.94 | $ 27.28 | $ 56,750 |
| Miami-Fort Lauderdale-West Palm Beach, FL | 7,950 | 3.24 | 1.43 | $ 25.54 | $ 53,130 |
| Dallas-Fort Worth-Arlington, TX | 7,500 | 2.09 | 0.92 | $ 27.27 | $ 56,710 |
| Washington-Arlington-Alexandria, DC-VA-MD-WV | 6,880 | 2.34 | 1.04 | $ 30.06 | $ 62,530 |
| Phoenix-Mesa-Scottsdale, AZ | 6,280 | 2.97 | 1.31 | $ 24.26 | $ 50,470 |
| Houston-The Woodlands-Sugar Land, TX | 5,840 | 2.02 | 0.89 | $ 26.81 | $ 55,760 |
| Atlanta-Sandy Springs-Roswell, GA | 5,490 | 2.12 | 0.94 | $ 26.97 | $ 56,090 |
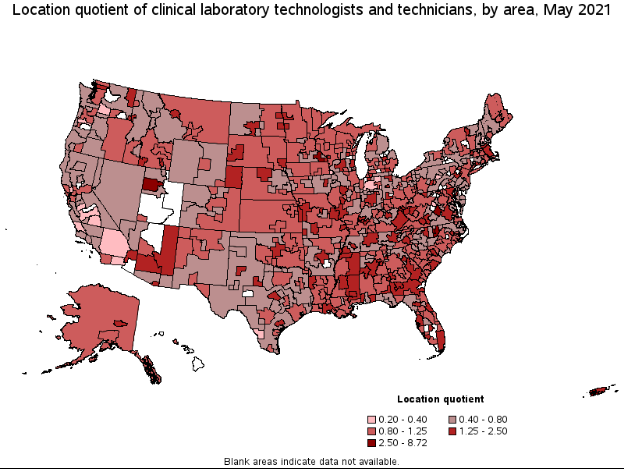
Metropolitan areas with the highest concentration of jobs and location quotients in Clinical Laboratory Technologists and Technicians:
| Metropolitan area | Employment (1) | Employment per thousand jobs | Location quotient (9) | Hourly mean wage | Annual mean wage (2) |
|---|---|---|---|---|---|
| Burlington, NC | 1,220 | 19.74 | 8.72 | $ 25.91 | $ 53,880 |
| Charlottesville, VA | 760 | 7.16 | 3.16 | $ 26.80 | $ 55,740 |
| Rochester, MN | 790 | 6.82 | 3.01 | $ 28.14 | $ 58,540 |
| Durham-Chapel Hill, NC | 1,990 | 6.37 | 2.81 | $ 26.35 | $ 54,800 |
| Salt Lake City, UT | 4,220 | 5.68 | 2.51 | $ 24.48 | $ 50,920 |
| Gainesville, FL | 710 | 5.35 | 2.36 | $ 25.64 | $ 53,330 |
| Columbia, MO | 500 | 5.34 | 2.36 | $ 22.20 | $ 46,170 |
| Morgantown, WV | 310 | 5.01 | 2.21 | $ 26.61 | $ 55,340 |
| Dothan, AL | 280 | 4.99 | 2.21 | $ 20.00 | $ 41,600 |
| Birmingham-Hoover, AL | 2,340 | 4.84 | 2.14 | $ 23.76 | $ 49,410 |
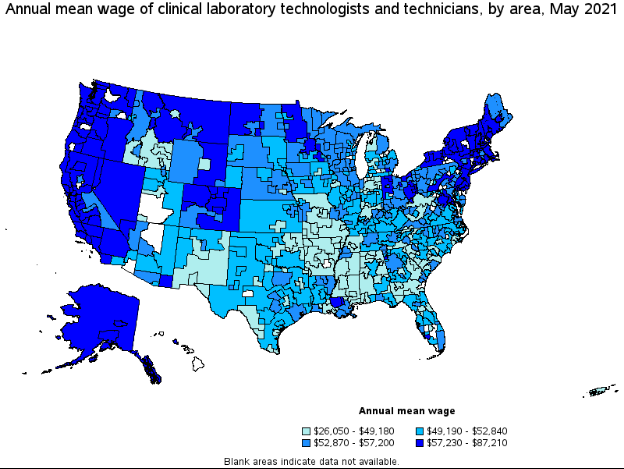
Top paying metropolitan areas for Clinical Laboratory Technologists and Technicians:
| Metropolitan area | Employment (1) | Employment per thousand jobs | Location quotient (9) | Hourly mean wage | Annual mean wage (2) |
|---|---|---|---|---|---|
| jobs | |||||
| Redding, CA | 90 | 1.31 | 0.58 | $ 41.93 | $ 87,210 |
| Napa, CA | 50 | 0.78 | 0.35 | $ 41.47 | $ 86,260 |
| Merced, CA | 50 | 0.70 | 0.31 | $ 39.69 | $ 82,560 |
| San Jose-Sunnyvale-Santa Clara, CA | 1,370 | 1.29 | 0.57 | $ 37.09 | $ 77,150 |
| San Francisco-Oakland-Hayward, CA | 4,380 | 1.96 | 0.86 | $ 36.70 | $ 76,330 |
| Sacramento--Roseville--Arden-Arcade, CA | 1,830 | 1.86 | 0.82 | $ 35.24 | $ 73,290 |
| Bend-Redmond, OR | 90 | 1.13 | 0.50 | $ 35.23 | $ 73,280 |
| New York-Newark-Jersey City, NY-NJ-PA | 18,400 | 2.12 | 0.94 | $ 35.06 | $ 72,930 |
| Norwich-New London-Westerly, CT-RI | 220 | 1.91 | 0.84 | $ 35.04 | $ 72,870 |
| Bridgeport-Stamford-Norwalk, CT | 870 | 2.32 | 1.03 | $ 34.74 | $ 72,270 |
Nonmetropolitan areas with the highest employment in Clinical Laboratory Technologists and Technicians:
| Nonmetropolitan area | Employment (1) | Employment per thousand jobs | Location quotient (9) | Hourly mean wage | Annual mean wage (2) |
|---|---|---|---|---|---|
| Kansas nonmetropolitan area | 860 | 2.28 | 1.01 | $ 25.10 | $ 52,200 |
| South Georgia nonmetropolitan area | 640 | 3.49 | 1.54 | $ 22.48 | $ 46,760 |
| Northeast Mississippi nonmetropolitan area | 630 | 2.85 | 1.26 | $ 20.69 | $ 43,040 |
| North Northeastern Ohio nonmetropolitan area (noncontiguous) | 560 | 1.77 | 0.78 | $ 26.71 | $ 55,560 |
| Southeast Mississippi nonmetropolitan area | 450 | 3.17 | 1.40 | $ 20.18 | $ 41,970 |
Nonmetropolitan areas with the highest concentration of jobs and location quotients in Clinical Laboratory Technologists and Technicians:
| Nonmetropolitan area | Employment (1) | Employment per thousand jobs | Location quotient (9) | Hourly mean wage | Annual mean wage (2) |
|---|---|---|---|---|---|
| East Georgia nonmetropolitan area | 320 | 3.81 | 1.68 | $ 20.98 | $ 43,630 |
| South Georgia nonmetropolitan area | 640 | 3.49 | 1.54 | $ 22.48 | $ 46,760 |
| East Kentucky nonmetropolitan area | 330 | 3.45 | 1.52 | $ 23.84 | $ 49,600 |
| Arizona nonmetropolitan | 290 | 3.17 | 1.40 | $ 24.71 | $ 51,390 |
| Southeast Mississippi nonmetropolitan area | 450 | 3.17 | 1.40 | $ 20.18 | $ 41,970 |
Top paying nonmetropolitan areas for Clinical Laboratory Technologists and Technicians:
| Nonmetropolitan area | Employment (1) | Employment per thousand jobs | Location quotient (9) | Hourly mean wage | Annual mean wage (2) |
|---|---|---|---|---|---|
| North Valley-Northern Mountains Region of California nonmetropolitan area | 120 | 1.19 | 0.52 | $ 39.19 | $ 81,510 |
| North Coast Region of California nonmetropolitan area | 120 | 1.20 | 0.53 | $ 36.55 | $ 76,020 |
| Coast Oregon nonmetropolitan area | 160 | 1.42 | 0.63 | $ 35.52 | $ 73,880 |
| Massachusetts nonmetropolitan area | 60 | 1.09 | 0.48 | $ 35.31 | $ 73,440 |
| Western Washington nonmetropolitan area | 160 | 1.33 | 0.59 | $ 34.09 | $ 70,910 |